The file has been added to your downloads selection. Please go to my downloads to download all files in your download basket.
OK
MY DOWNLOADS


OPTIMIZING DELIVERY SUCCESS
Here are some top level guidelines to help you to optimise delivery success:
- Potential pit-falls: The following areas of risk have been identified, and should be mitigated fully before commencing to implement a delivery operation.
- Consumer experience and damage to brand from inadequate quality of food on delivery if not monitored appropriately
- Cannibalisation of existing store sales (both from the store introducing delivery and nearby stores where customers change to Delivery
- Blocking potential new core store builds by reducing the future customer base and offering delivery outside their current trade zone
- Parameters to be considered:
- Delivery should only operate within a target area of, or within an entire - existing trade zone. This reduces the risk of cannibalisation of existing and potential new stores.
- Delivery catchment should not cover multiple trade zones. It also requires the full agreement of the Market Plan between the operator and Yum.
- There should be a robust and regular operations review of delivery and at the same time, a review of the market plan to ensure no trade zones exceed the size deemed appropriate to maintain food quality.
- GES customer feedback monitoring must be introduced as standard for delivery orders so that the brand and customer impact can be monitored and responded to.
OPTIMIZING DELIVERY SUCCESS
- Delivery Guidelines
- Frequency Driver - KFC Delivery is built around a frequency driving strategy, and is not intended to increase or enhance brand penetration. Therefore the approach to trade zone management should ensure that any future growth and development of the KFC brand is unaffected by the implementation of delivery.
- 8 Minute Drive Time – All delivery operations will be restricted to adhering to an 8 minute drive time from the delivering restaurant to the customer, both to protect food quality, but also to ensure the ongoing integrity of the trade zones. For balance, consistency and fairness, this 8 minute drive time will be derived using a Yum endorsed market planning tool. You should note that walking time will be taken into account as part of the overall “Drive time”: drive time is calculated by activating the timer via a button on the way out of the store and stopping it once returned to store, this time is then divided by 2 (assuming that there is equal travel time to and from the customer - these times will be reviewed regularly)
- 8 Minutes Maximum - It should be noted that the 8 minute drive time is a maximum drive time, not a best practice, recommendation, median, or mid-point.
- Potential Trade Zones – which have not yet seen a KFC built should not be used to “test” the future potential viability of a KFC restaurant in the trade zone, by testing, trailing, or otherwise implementing delivery operations in potential trade zones.
- Delivery will not be permitted to operate outside of agreed trade zones, although, if there is an area which is within an 8 minute drive time of an existing restaurant, but this geographical area is not covered by an existing, or potential trade zone, customers within this geography may be delivered to.
OPTIMIZING DELIVERY SUCCESS
- Food court assets - are not an approved asset type for the KFC Delivery Channel due to their reduced accessibility for delivery drivers, and the nature of the trade area. As a consequence, operators will need to request prior approval of Yum before any launch of the KFC Delivery Channel in any food court. In case food court assets are approved to operate the KFC Delivery Channel, corresponding trade zones will be specific to this asset type to take into account the fact that clientele of food courts is considered as captive.
- Yum reserves the right to alter the trade zone parameters, and approved delivery asset types as it sees fit, providing the opportunity to the operator to input into such changes.
Note: Delivery drive times can be taken upto 10 minutes provided the customer order is delivered within 30 minutes. Delivery < 30 minutes is a non-negotiable standard.
MARKET MAPPING
In markets which have established market planning tools and systems, such as Geoplan SKiN or Tango Analytics, a slightly different approach to top level delivery zone planning can be taken. Here we use the case study of the Cypriot market to showcase how system driven delivery planning can be achieved.
Market planning tool – Geo Mapping
Workflow of the basic system driven-approach
Systems used: Geoplan SKiN (http://www.geoplan.com/all-products/mapping-software-shop/online/online-mapping/index.html)
MARKET MAPPING
-
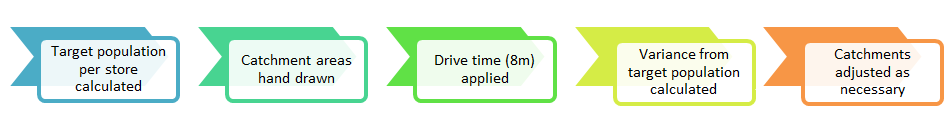
Step 1 : Calculate target population per store
Deemed 20% population in catchment required to meet monthly PST (This was calculated based on the consuming class% data for the country being mapped) WPST obtained for each store (excluding malls as captive environment) Monthly PST Calculated = WPST * 4 Target Population per catchment calculated = Monthly PST * 5
# Store WPST Monthly WPST Population Required 1 Paphos Posidinos St 889 3,566 17,780 2 Pafos 2 891 3,564 17,820 3 Paphos 3 946 3,784 18,920
Assumptions:- 50000 households based on 1:8 people per household = 90000
Reduced to 80K as FC (which is captive).
This will equate to $26mm or 4000 trans per weekPopulation base per trade zone is flexed up or down based on spending power (consumer affordability)
MARKET MAPPING
-
Step 2 – Catchments hand drawn
4 digit postcode layer turned on, illustrating postcode boundary and postcode name in centre. - Darker the shading; higher the population density
- Population density indicated per postcode catchment
WPST obtained for each store (excluding malls as captive environment) Monthly PST Calculated = WPST * 4 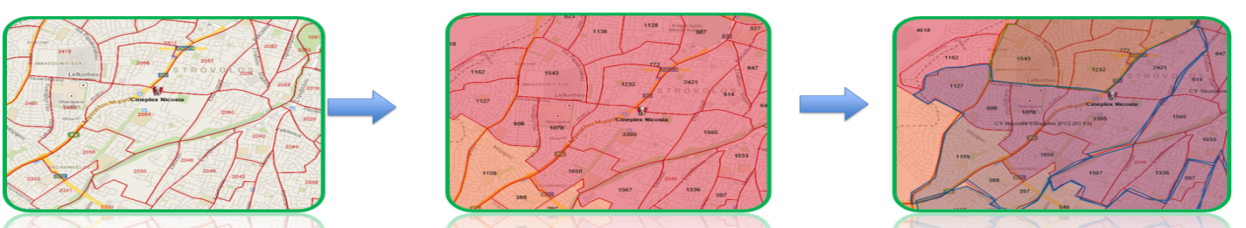
MARKET MAPPING
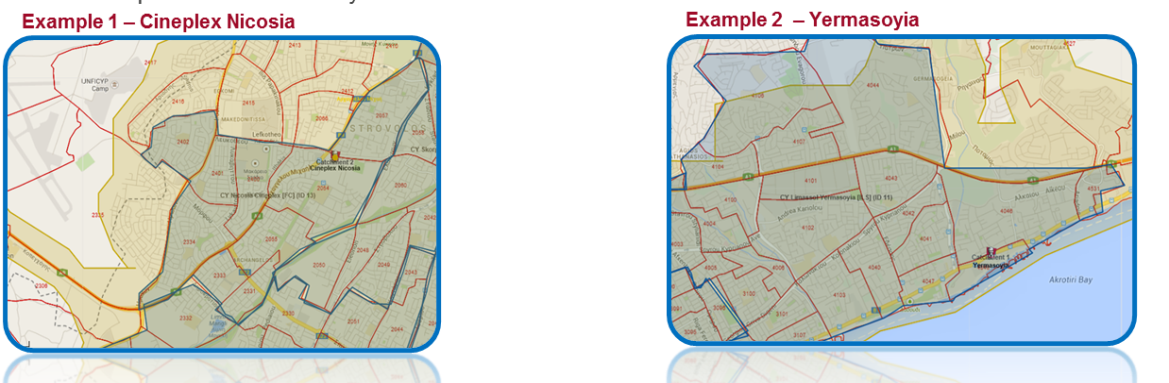
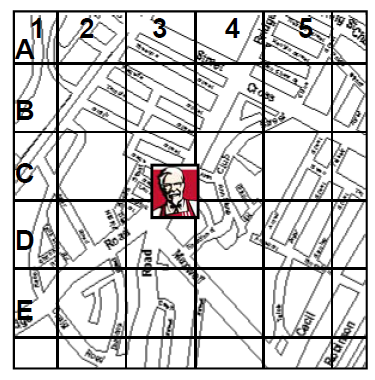
- Step 3 – Assessing 8 Minute Drive time
- Drive time of 8 mins calculated from store location and compared to hand drawn trade zone.
- Trade zone adjusted as necessary
- Travel time varied by region with significant overlaps in areas
- Blue = Hand drawn catchments
- Yellow = 8 min travel time
- Red = Postcode boundary
Key to examples below:-
MARKET MAPPING
- Step 4 – Assessing variances to population targets per delivery zone
- Target exceeded = Safe
Target population exceeded therefore store considered to be serviced by local population - Deficit < 10% = Balanced
Accepted Variance - Deficit > 10% = Risk
Stores requiring further investigations
- Target exceeded = Safe
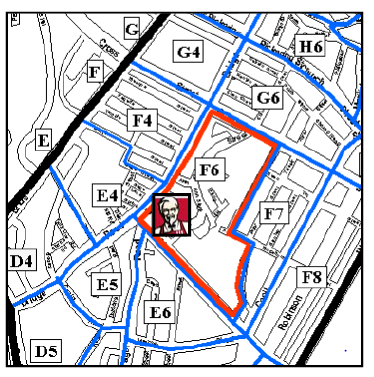
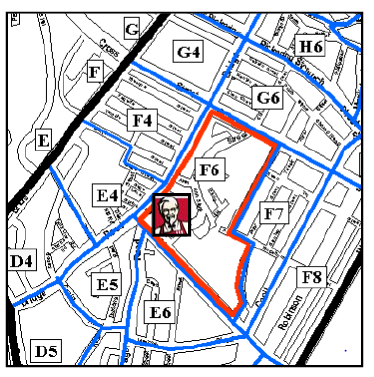
- Step 5 – Catchments are then adjusted by hand
In order to arrive at, or close to the target population per delivery zone subject the variance tolerances above, the trade zones are then adjusted and amended by hand.
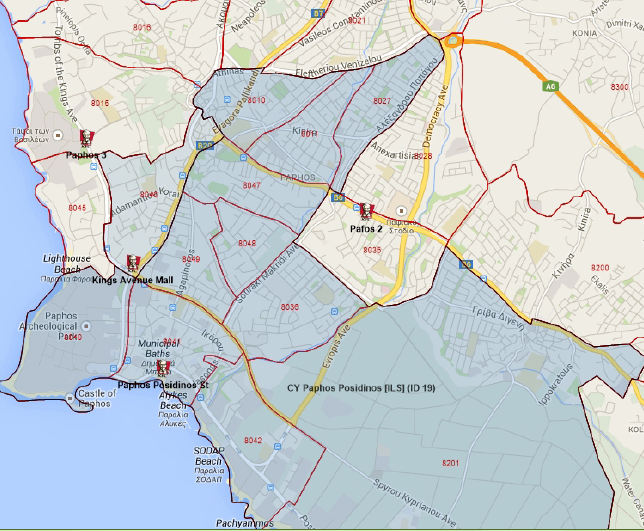
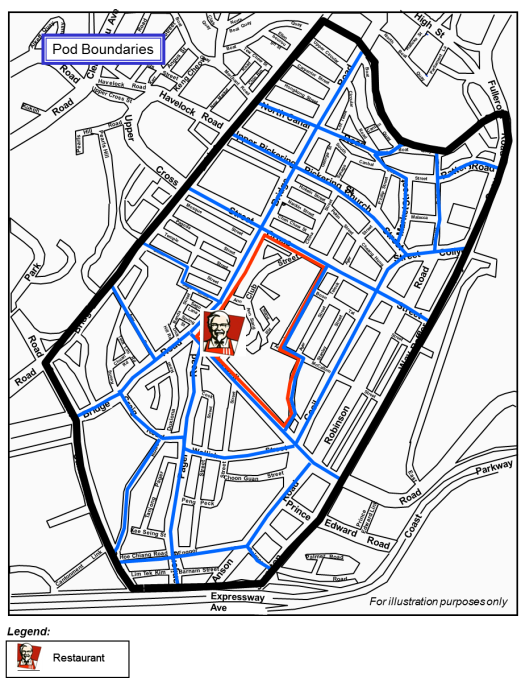
MARKET MAPPING
Below is an example of a completed top-level delivery zone plan for a market which shows various delivery zones:
You may also download the presentation from KFC Cyprus from the link below:
DEVELOPING STORE TRADE AREA MAP
Trade area identification and mapping
The goal of the Trade Area Identification Process is to perform a Demographic and Drive Time Analysis to establish preliminary Trade Area Boundaries. If you don’t have in your market, an established trade zone mapping system, or software platform such as Geoplan SKiN or Tango Analytics, manual trade zone assessment can be completed
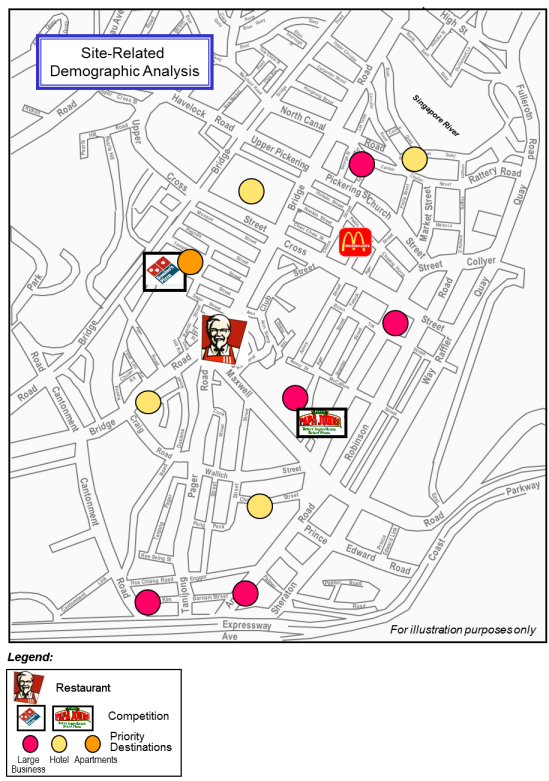
- Step 1:Complete a Site-Related Demographic Analysis
- Get a scaled map of the market (Google map can also be used)
- Use a local street map that shows all residential streets in a scale of approximately 2.5 cm = 1/5 kilometer (1 in. = 1/8 mile).
- Mark on the map:
- Restaurant(s) locations/Restaurant number(s)
- Competitors
- Priority destinations (any building or area that may generate particularly heavy order volume); mark with colour-coded dots.
- Examples:
- Large military installations - blue dots
- Universities with substantial on-campus residents (as opposed to "commuter" colleges) - pink dots
- Large apartment complexes - orange dots
- Hospitals - purple dots
- Large employers/businesses - red dots
- Hotels/motels - yellow dots
|
|
 |
||
DEVELOPING STORE TRADE AREA MAP
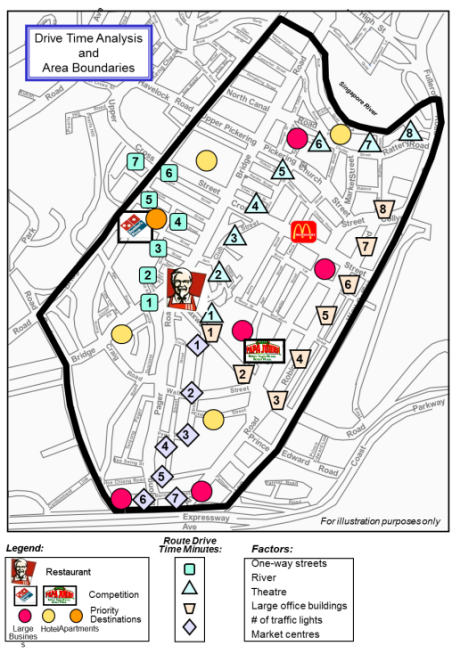
- Step 2: Conduct Drive Time Analysis
- Drive the trade area in all four directions during the evening rush hour (usually 5:00 to 6:00 p.m.).
- Plot 1-minute drive time increments up to 8 minutes on each route you drive.
- Note factors that affect drive time:
- Restaurant entrance and exit
- Physical barriers
- Traffic volumes and patterns
- Rush hours which often coincide with peak delivery sales hours.
- Freeway interchanges and intersections which back up during peak times.
|
NOTE: Contact Planning Commission, Traffic Department, or Police Department or local governments as a resource for published traffic count data. |
 |
||
DEVELOPING STORE TRADE AREA MAP
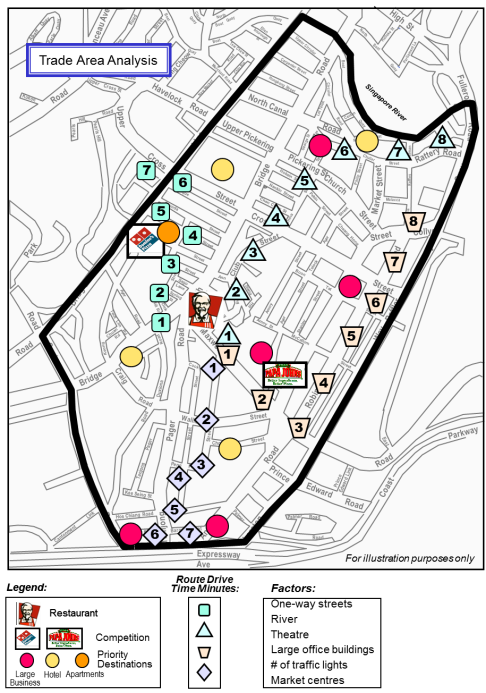
- Step 3: Plot Trade Area Boundaries
- Plot boundary markers at nearby major intersections, creeks, hills, undeveloped land, etc., that do not exceed 8-minute drive times. Focus intently on non-populated areas as these may create delivery zones that are only 50% populated, which in turn will affect delivery sales further down the line.
- Don’t split trade area boundary streets unless it is divided by a barrier, highway, traffic, etc.
- Any intentionally un serviced areas should be clearly marked.
- Don’t attempt to change your trade area boundaries before the full potential of your initial area is known. Otherwise, you may get more orders than can be handled within your on-time goals.
- Any expansions or reductions to your Trade Area must be approved. Submit the Trade Area Modifications Procedures form in the Appendix to obtain approval.
|
NOTES: |
DEVELOPING STORE TRADE AREA MAP
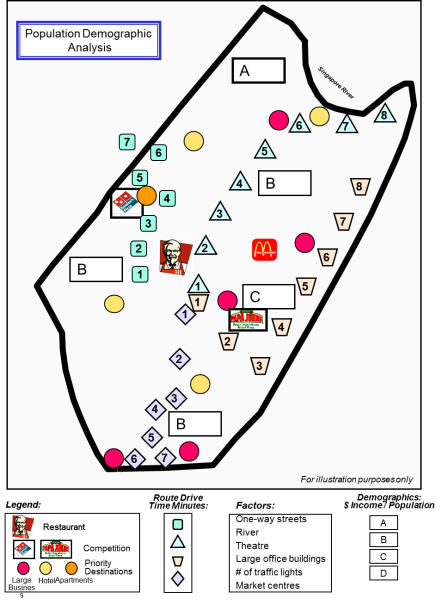
- Step 4: Complete a Population Demographic Analysis
- Obtain demographic information about the population in your trade area
- Indicate the information on your map.
- Assess the strength of your trade area by comparing it to your local area guidelines
- Total population within 8 minutes’ drive time
- Total Households within 8 minutes’ drive time
- Socio-economic classification (if available in your market)
- If the above is not available, you can use disposable income, or ‘Spending Power’ data instead
- Target population within 8 minutes’ drive time
- Median Age
- Consumer profile
- Minimum target household in 2 minutes’ drive time
|
Demographic Guidelines NOTE: Contact Planning Commission, Traffic Department, or Police Department or local governments as a resource for published traffic count data. |
 |
||
DEVELOPING STORE TRADE AREA MAP
- Step 5: Submit Map(s) for approval
- When completed, submit the maps for each restaurant within a market or general area together in one package to your Area Coach. At a top market level, there should be one person co-ordinating market planning and delivery mapping to ensure balance and fairness.
|
Watch the video on how to do the mapping and podding |
DEVELOPING STORE TRADE AREA MAP
Trade Area Analysis
The purpose of doing a Trade Area Analysis is to help you identify how well you are maximising your sales potential. If you are exceeding 8-minute drive times, you are probably not servicing your customers.
I’m already in the delivery business; why should I analyse my existing trade area?
Consider these reasons:
- Trade areas are often inherited from previous operators who have varying levels of experience and attention to detail.
- System wide, KFC’s sophistication in mapping fundamentals has increased since the creation of most recent trade area maps. Many markets now have advanced systems which make this process simpler, and very accurate.
- Changes in the demographics, geographies, growth migration, and competition affect your ability to maximise service and sales. Every trade area should be analysed at least every three years. From a best practice standpoint, a review should be completed every year in densely populated areas, subject to the availability of date.
- Trade areas with exploding population growth should be re-examined as often as every six months.
DEVELOPING STORE TRADE AREA MAP
Trade Area Analysis Guidelines
|
 |
||
DEVELOPING STORE TRADE AREA MAP
|
|
||
Click here to download Rider Trade Area Analysis Form Rider Trade Area Analysis
DEVELOPING STORE TRADE AREA MAP
Trade Area Reductions/Expansions
Occasionally operational changes and other event changes, such as new crime patterns, require delivery trade area modifications. We value treating our customers with respect and dignity. We apply consistent fact-based measures and processes to trade area modifications to prevent our intentions from being misconstrued as discriminatory or arbitrary in any manner. Adoption and execution of the intent of a trade area reduction or expansion policy has an impact on financial and public relations exposure.
- Involve the Support Team
- Always involve Area Coaches, Franchise Key Operators in trade area modification decisions, noting that there has to be a final decision maker or arbitrator.
- For security and team member safety, specialists should be involved in reductions because of customer service issues
- Ensure that the trade areas are clearly delineated to avoid confusion, especially if there is a risk that two separate franchise operators could be delivering to the same address. Trade zone maps should always therefore go down to street address level.
DEVELOPING STORE TRADE AREA MAP
- Modification Procedures
- To be fair and consistent, procedures for trade area modifications need to be clearly outlined.
- For company-owned restaurants, no area can be considered non-deliverable until all the provisions of local policy are met. Any non-deliverable area should be indicated on the new map. Ideally, shade the area in a way that streets are still identifiable. This is especially important if riders/drivers need to travel through these areas to reach other destinations.
- Any expansions or modifications to your Trade Area must be approved.
- Click here to download the Trade Area Modification Approval form Trade Area Modification Approval
Smart operators don't assume, they're set up for delivery excellence…are constantly planning for success!
PODDING
Overview of Mapping
Each trade area has its own combination of traffic problems, natural and man-made barriers, and priority destinations that impact delivery times. Whether your restaurant has a manual or automated dispatch system, you can improve your speed of service by improving your trade area maps to account for these limitations. You can improve your trade area maps by completing a Trade Area Analysis and podding (not gridding) your trade area map.
Gridding
Delivery maps were first gridded with uniform 1.3 square kilometer (½ square mile) grids. This method incorrectly assumed that each grid had identical physical features. This approach provides false information to the automated dispatching function which could result in incorrect dispatching. It also places a disproportionate amount of pressure upon some drivers, forcing them to take risks to achieve target delivery service times in their allocated delivery areas or grids. |
 |
||
PODDING
Podding
Podding maps reflect natural and physical boundaries. This approach represents a more accurate picture of the source of our business and the natural or man-made barriers that interfere with our ability to get from one place to another. Podding:
|
 |
||
This section details the process for creating a map that supports manual or other system functions. You can use a mapping vendor in countries which have them.
PODDING
Creating Podded Maps
|
|||
PODDING
|
|
||
PODDING
|
|
||
Note : Smaller geographical areas that generate frequent orders should be their own pod sections. These areas of high volume enhance the possibility of multiple dispatches. Large colleges or universities are also good candidates for separate pods.
PODDING
Assign pod coordinates
|
|||
PODDING
|
|
||
PODDING
|
|||
PODDING
|
|||
PODDING
Alpha Listing
An alpha street listing can be used by order takers to verify that an address is within the delivery trade area before taking an order. Riders can use the alpha street listing to quickly help find a location on the trade area map.
- Begin by making a list of all the streets in your trade area.
- There are a number of resources available to obtain street names and ranges that can save you a great deal of time. Use as many of these resources as possible:
- Election Bureau - Street ranges are found on these maps in detail. They can be purchased upon request.
- City Street Index - The index can be purchased at local bookstores or through government agencies.
- Running Routes - Local fire departments maintain "Running Routes" which can be very helpful for trade area details. Fire department maps are very accurate and detailed with apartment complexes and other specific address information. Caution: Be aware that "Running Routes" are shown from the vantage point of the fire department's location. If your restaurant is in an opposite direction from the address of the fire department, you must reverse the directions on the "Running Route.”
- Zoning/Planning Office - You may be able to purchase a copy of the tax map or public works map showing every house by street and house number. These are called plat maps. (It may be less expensive to purchase plat maps through a local blueprint company.) Many cities now have aerial topographical maps. They are usually more costly than plat maps.
- Highlight the streets on your duplicate trade area map as you add them to your alpha list.
- This will help you verify that you have included all the streets in your trade area on your alpha listing
PODDING
- Try to keep your list in alphabetical order as you go through this process.
- When you have all the streets listed, go back and finalise the alphabetical order.
- Create a spread sheet on a personal computer to sort your listing in alphabetical order after you complete it.
- As you make your list, include street ranges and pod coordinates. List the street as many times because it crosses into a different pod coordinate.
For example:-
| Street Name | Range | Pod Coordinate |
| Oak St. | 1776-1989 | F-5 |
| Oak St. | 1990-2103 | F-6 |
- Colour code the street ranges to correspond to their location in the colour coded and numbered section on the trade area map.
- After podding your map, many streets will cross over into differing pods. Therefore, the alpha listing should contain street ranges that correspond to the pod ranges on the podded map.
NOTE: If a restaurant serves the majority of the community, it may be easier to have a listing of the streets that are not served. This decision should be made on a restaurant-by-restaurant basis. However, unless the dispatcher is very familiar with the streets that are served, multiple order deliveries may be overlooked.
Alpha listings can be bound in notebooks and used as a counter reference. Pages should also be posted on the wall adjacent to the trade area map for quick reference.
PODDING
If You Have Current Alpha Listings
- Start with an old alpha listing as a reference.
- Compare the street ranges and pod sections on the current alpha listing with the new map pod sections. Determine where the streets cross the new pod lines.
- On the alpha listing, change any street ranges and pod coordinates to match the new map and pod sections. Highlight each street on the smaller duplicate map as it is modified on the alpha listing to make sure every street in the trade area is included.
- After updating street ranges and pod coordinates, colour code the alpha listing to match the trade area map. Be sure to indicate the coordinates on the alpha listing.
Post the Podded Map and Convert Alpha Listings
- Do not post the podded map until you have converted the alpha listings. If you do, the alpha listings and map will not match, which will confuse riders and dispatchers.
- Once you’ve converted the alpha listings, post the podded map near the rider exit. Riders can easily make a final check just before leaving on a delivery without interfering with takeaway customers and Team Members as they enter and exit the restaurant. Ideally, the map should be accessible to the dispatcher as well to facilitate coaching the rider on possible routes.
- Post one converted alpha listing at each order taking station.
- When you post the map, cover it with plexiglass or have it laminated.
PODDING
NOTES:
- Don't place "GEO" tape boundaries and trade area outlines on top of the laminated map/plexiglass. In a short time, normal wear will cause the markings to fall off or become distorted.
- After you have converted your alpha listings, send a copy of your podded trade area to your area coach or relevant authority in your country.
Execution:
When working with your newly converted maps, ensure that:
- Order takers mark the order with a corresponding coloured marker or write the colour (such as blue) and the pod number on the delivery ticket.
- Dispatchers are aware of deliveries that may be close enough together for one rider even though the locations are in different sections. (Paired orders should never be more than 5 minutes apart.)
- Writing the pod coordinate on the order will enable the dispatcher to quickly recognise two deliveries that can be batched even though they don't fall within the same pod.
Remember that intelligent dispatching is only as good as the map podding.
BEST PRACTICES
Click here to download an example of a perfectly executed map. This market uses external vendor to develop the store trade area map.


Where will I Deliver